
How to Build and Run High-Performance Data Pipelines with Twin Talk
In today’s rapidly evolving industrial environments, the ability to move data from where it’s generated to where it can be used is critical. Whether you’re enabling predictive maintenance, real-time monitoring, or generative AI workflows, everything starts with one crucial building block: a data pipeline. At EOT.AI, our flagship integration tool, Twin Talk, is designed to do just that—transform your operational data into value streams.
What Is a Data Pipeline?
At its core, a data pipeline is a defined process that extracts data from a source, transforms and contextualizes it, and delivers it to a target system for analysis, storage, or application integration.
Think of it as a manufacturing line for data: raw material (sensor readings, logs, or time-series data) is ingested, shaped, and packaged before being shipped off to a warehouse (like Databricks, Snowflake, or a real-time dashboard). A great data pipeline is fast, flexible, and reliable, ensuring clean and enriched data lands exactly where it’s needed.
Why Data Pipelines Matter in Industrial Settings
In operational environments, data is often locked inside siloed systems like SCADA, PLC, or historian systems (e.g., PI). These systems weren’t designed for modern cloud analytics or machine learning. Without a data pipeline, getting this data to the cloud—or even into an enterprise dashboard—is a manual, brittle, and slow process.
Key Reasons to Use Data Pipelines in Industry:
- Enable predictive maintenance by aggregating time-series sensor data.
- Fuel generative AI and ML workflows by making historical and real-time data accessible.
- Improve data quality by applying transformations like filtering, interpolating, or aggregating.
- Automate routine reporting and compliance metrics.
- Simplify access across teams: OT, IT, data scientists, and business users.
Twin Talk: The Engine Behind EOT.AI’s Pipelines
Twin Talk is an event-driven data orchestration engine that securely moves industrial data from OT systems to cloud destinations. Think of it as the brain and backbone of your industrial data operations.
Typical Data Sources:
- PI Archive and PI AF servers
- OPC-UA
- MQTT
- MODBUS / TCP/IP / legacy protocols
- REST APIs
- Local databases and CSVs
Typical Destinations:
- Databricks
- Snowflake
- Google Cloud Storage / BigQuery
- AWS S3 / Redshift
- Azure Blob / Synapse
- Custom APIs
With Twin Talk, you define “Groups” of tags or sensors (also called Curated Groups), and then set up “Timers” that dictate when and how data is extracted, transformed, and transported.
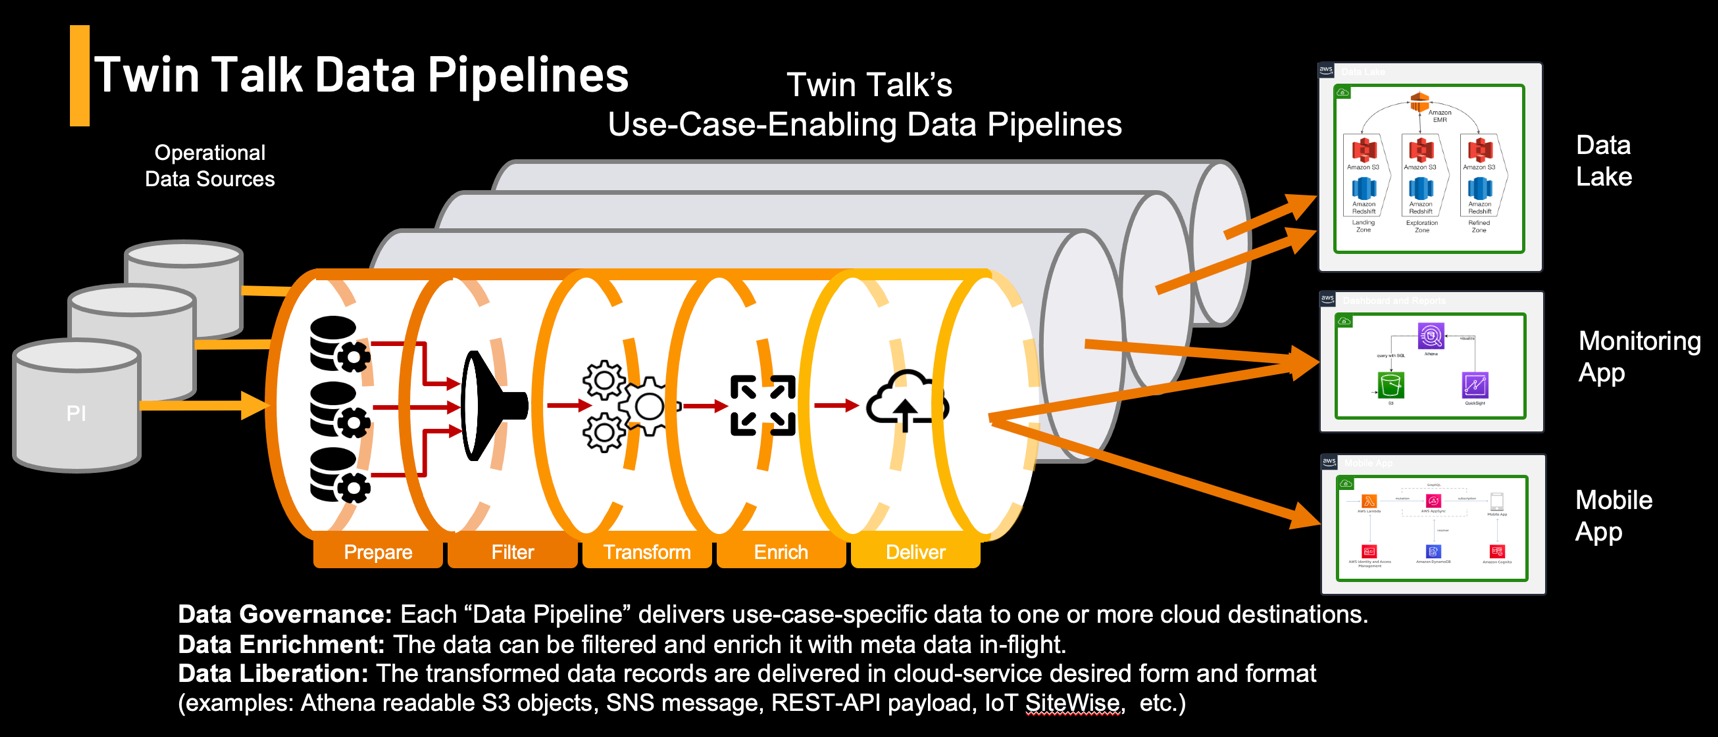
Twin Talk Data Pipeline Stages
Each pipeline includes six stages:
- Data Acquisition – Connects to source systems like PI, OPC-UA, or SQL databases.
- Data Governance – Applies access rules, schemas, and identity handling.
- Metadata Enrichment – Adds location, unit, status, or quality info.
- Data Contextualization – Aligns sensor data with assets, events, or process models (e.g., AF hierarchy).
- Data Transformation – Aggregates, interpolates, filters, and normalizes values.
- Data Transportation – Pushes output to cloud data lakes, dashboards, or APIs.
These pipelines are configured using the Twin Talk UI or API in a no-code approach.
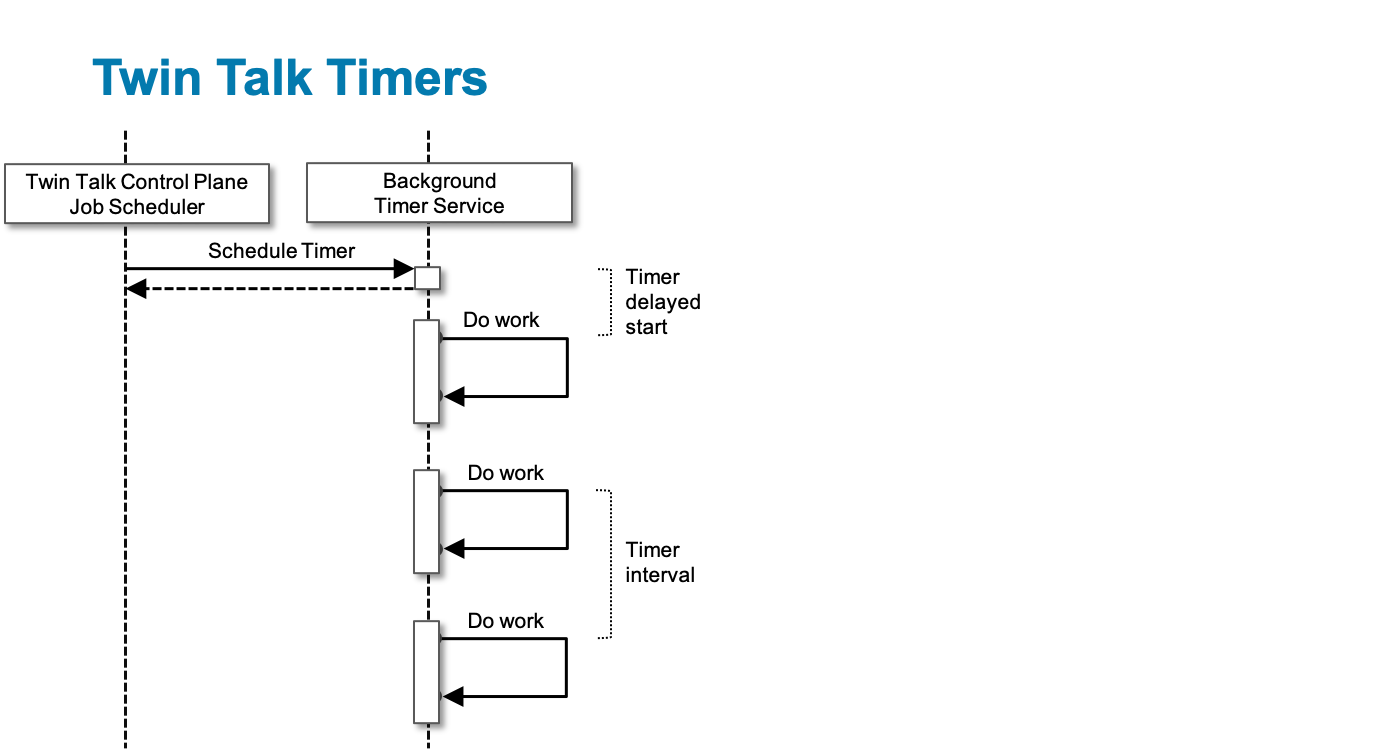
The Role of Timers in Twin Talk Pipelines
A Timer in Twin Talk controls the frequency and type of data extraction. It’s essentially a schedule and method definition for pulling data.
Twin Talk supports five Timer Methods:
- Interpolated – Fills in values between known points (for trend analysis).
- Aggregated – Summarizes values over time (average, max, min, etc.).
- Most Recent – Retrieves the latest value in a period.
- Subscription – Streams data in real-time as it arrives.
- Recorded – Pulls exact logged values over a time window.
Each timer defines:
- Data range (e.g., last 6 hours, last day)
- Delivery format (JSON, CSV, compressed)
- Target system (S3, BigQuery, HTTP endpoint)
- Custom variables (timestamps, asset names, etc.)
Example: Setting Up an Aggregated Pipeline
Let’s say you want to analyze vibration sensor data from multiple pumps in your facility and calculate hourly averages.
Step 1: Define a Group with the tags: Pump1_Vibration, Pump2_Vibration, etc.
Step 2: Create a Timer using the Aggregated method:
- Set interval:
-24hto*(past 24 hours) - Aggregation:
Average - Output: JSON format to an S3 bucket
- Frequency: every hour
Step 3: Twin Talk automatically runs the data pipeline every hour and pushes results into S3.
Now your ML team can use this structured data to build anomaly detection models in Databricks or feed it into dashboards.
Timer Method Deep Dive
1. Interpolated
- Used to estimate values at specific time points between two known values.
- Example: You need a reading every 15 minutes, but sensors only update every hour.
- Twin Talk interpolates the values and fills the gaps.
2. Aggregated
- Useful for summarizing high-frequency signals.
- Supports
Max,Min,Avg,Range, etc. - Reduces data volume and noise before sending to the cloud.
3. Most Recent
- Pulls the most up-to-date value available in the system.
- Commonly used for dashboards, alerts, and trend lines.
4. Subscription
- Enables real-time data streaming.
- Whenever the data source (e.g., PI) updates, Twin Talk sends it to the destination.
5. Recorded
- Retrieves exact logged values for compliance, traceability, or backtesting.
Variables & Smart Routing
Twin Talk allows dynamic configuration of file names, paths, timestamps, and tag groups using variables like:
$DATE,$TIMESTAMP,$GROUPNAME- Bucket paths:
/plantX/$DATE/avg_values.json - Header info for API integration
This gives users fine-grained control and automation.
Twin Talk in Action: Real Use Cases
Predictive Maintenance
Twin Talk pipelines aggregate temperature, vibration, and pressure sensor data into 15-minute averages. This data feeds ML models that forecast bearing failures 3 days in advance—avoiding unplanned downtime.
Production Efficiency
Using the Subscription timer, real-time values from SCADA tags are streamed into a web dashboard for shift leaders. They monitor throughput in real time, flagging bottlenecks and underperforming assets.
Energy Optimization
Recorded value timers track hourly energy consumption by machine. The data is analyzed in Databricks to suggest load balancing or off-peak adjustments.
Data pipeline Chaining
Depending on your architecture requirements you can chain Twin Talk systems and data pipelines. For instance extracting data from PI on prem and transporting it into centralized MQTT brokers or OPCUA server in the DMZ. Then using another Twin Talk systems for transporting it to their final destination target system or cloud service.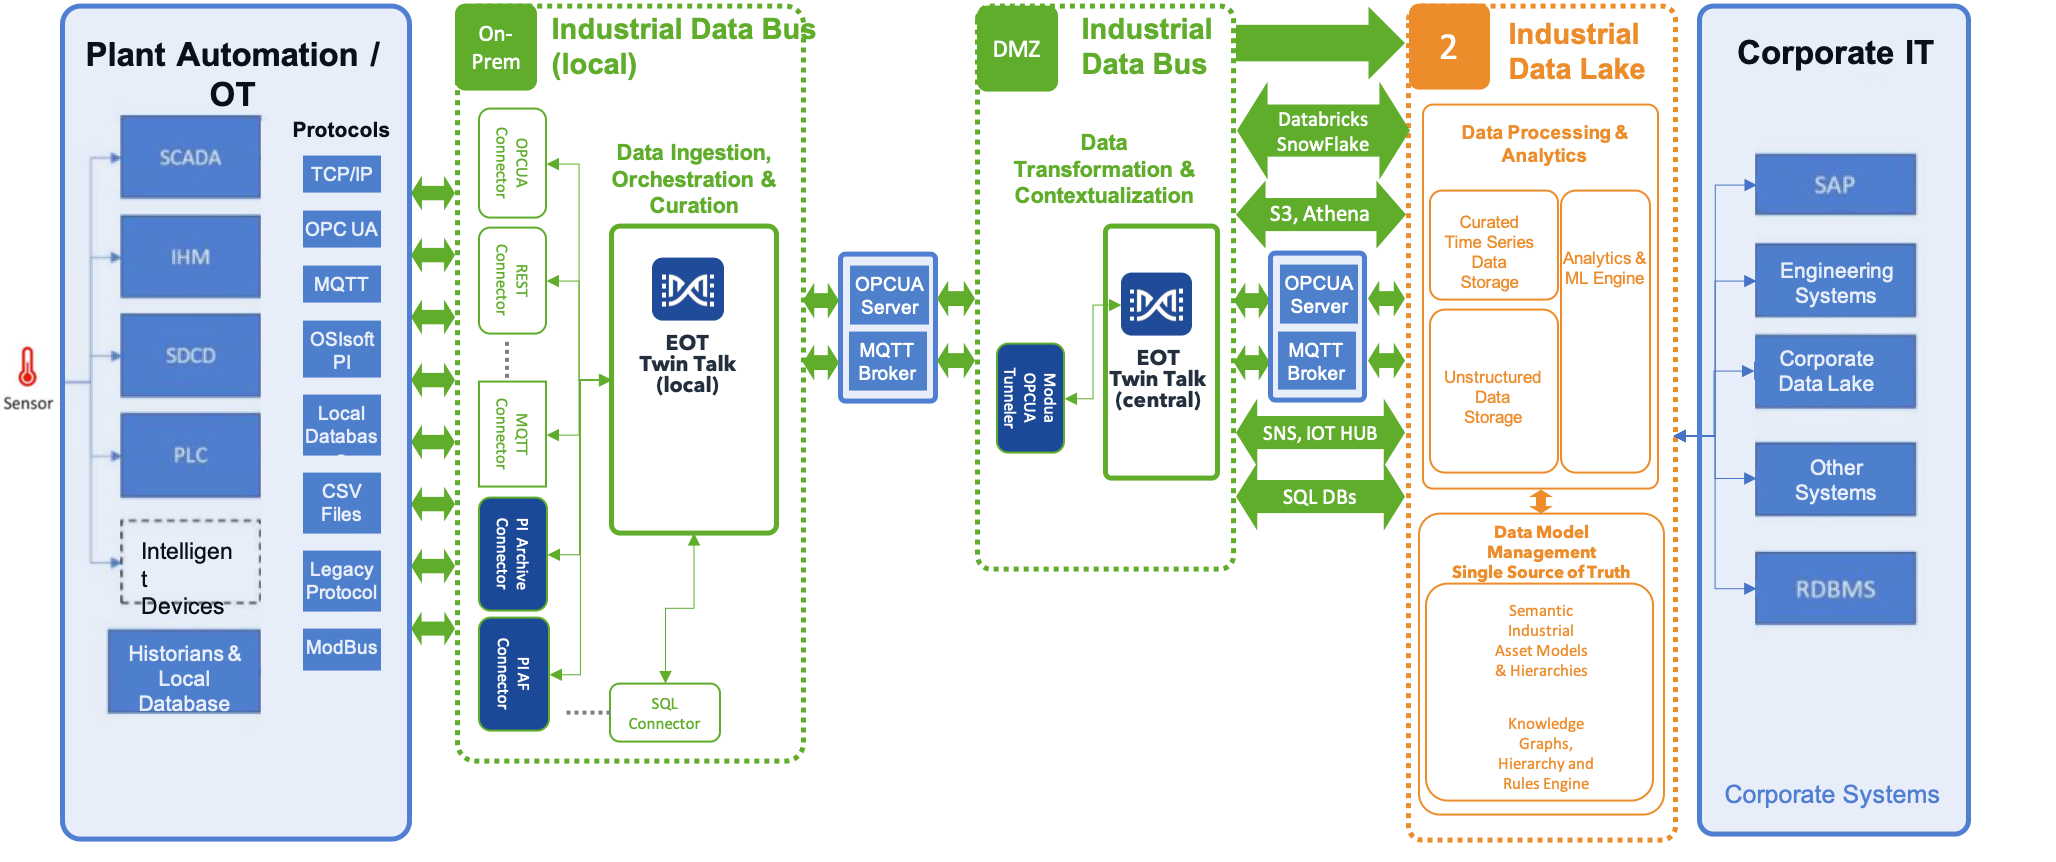
Conclusion: Data Pipelines Are the Heart of Industrial Intelligence
Modern industrial companies cannot afford to have slow or brittle data workflows. With Twin Talk, building a scalable, flexible, and powerful data pipeline becomes a no-code process that anyone in the organization—from OT engineers to data scientists—can understand and benefit from.
By mastering Timers and building smart pipelines, you empower your enterprise to bridge the OT/IT divide, embrace AI, and create real-time intelligence from every sensor, valve, and vibration reading in your operation.
Enterprise Industrial Platform
Why an enterprise industrial platform beats siloed tools — and unlocks aifor operations Point solutions that pull directly from historians or SCADA solve one problem

Reimagining industrial intelligence: How cloud historians can disrupt the automation landscape
EOT.AI’s “Twin Fusion” redefines industrial data handling – merging AI, cloud-native scalability, and real-time intelligence.
Learn how this disruptive approach changes the automation game.
Using ChatGPT to Build an IIoT Anomaly Detection Model and Export to ONNX for TwinSight
In this article, we’ll walk through how to use ChatGPT to create a Python program that: Loads and processes IIoT time series data, Trains an anomaly detection model to detect overheating, Converts the trained model to ONNX format,
Prepares it for deployment using TwinSight Machine Learning Workbench

Beyond data: What ‘Integrated Information Theory’ can teach us about AI and Digital Twins
Discover how Integrated Information Theory [IIT] reshapes the future of AI and Digital Twins.
Learn why connecting and integrating data is the key to building intelligent, adaptive operations.

From data silos to real-time twins – Why 2025 is the year of operational AI
AI isn’t just a trend – it’s transforming how industrial leaders harness their data.
Here’s how EOT.AI helps teams scale innovation from the shop floor to the cloud.
Reflections from AVEVA World 2025 – EOT.AI at the frontier of industrial AI
Explore EOT.AI’s key takeaways from AVEVA World 2025 in San Francisco.
Learn how industrial AI, digital twins, edge computing, and generative AI are shaping the future of data-driven operations.
Enterprise Industrial Platform
Why an enterprise industrial platform beats siloed tools — and unlocks aifor operations Point solutions that pull directly from historians or SCADA solve one problem
Reimagining industrial intelligence: How cloud historians can disrupt the automation landscape
EOT.AI’s “Twin Fusion” redefines industrial data handling – merging AI, cloud-native scalability, and real-time intelligence.
Learn how this disruptive approach changes the automation game.
Using ChatGPT to Build an IIoT Anomaly Detection Model and Export to ONNX for TwinSight
In this article, we’ll walk through how to use ChatGPT to create a Python program that: Loads and processes IIoT time series data, Trains an anomaly detection model to detect overheating, Converts the trained model to ONNX format,
Prepares it for deployment using TwinSight Machine Learning Workbench
Beyond data: What ‘Integrated Information Theory’ can teach us about AI and Digital Twins
Discover how Integrated Information Theory [IIT] reshapes the future of AI and Digital Twins.
Learn why connecting and integrating data is the key to building intelligent, adaptive operations.
From data silos to real-time twins – Why 2025 is the year of operational AI
AI isn’t just a trend – it’s transforming how industrial leaders harness their data.
Here’s how EOT.AI helps teams scale innovation from the shop floor to the cloud.
Reflections from AVEVA World 2025 – EOT.AI at the frontier of industrial AI
Explore EOT.AI’s key takeaways from AVEVA World 2025 in San Francisco.
Learn how industrial AI, digital twins, edge computing, and generative AI are shaping the future of data-driven operations.